Azure Portal dashboards
Let's look at how to create and modify dashboards using the Azure Portal, and by editing the underlying JSON file directly. In this unit, you'll learn your way around, and in the next unit you will try out the things you've learned.
What is a dashboard?
A dashboard is a customizable collection of UI tiles displayed in the Azure portal. You add, remove, and position tiles to create the exact view you want, and then save that view as a dashboard. Multiple dashboards are supported, and you can switch between them as needed. You can even share your dashboards with other team members.
Dashboards give you considerable flexibility regarding how you manage Azure. For example, you can create dashboards for specific roles within the organization, and then use role-based access control (RBAC) to control who can access that dashboard. Hence, your database administrator would have a dashboard that contains views of the SQL database service, whereas your Azure Active Directory administrator would have views of the users and groups within Azure AD. You can even customize the portal between your production and development environments within the portal - creating a specific dashboard for each environment you are managing.
Dashboards are stored as JavaScript Object Notation (JSON) files. This means they can be uploaded and downloaded to other computers, or shared with members of the Azure directory. Azure stores dashboards within resource groups, just like virtual machines or storage accounts that you can manage within the portal.
Tip
Because dashboards are JSON files, you can also customize them programmatically, making them compelling administrative tools. Also, some tile types can be query-based, so they update automatically when the source data changes.
Explore the default dashboard
The default dashboard is named "Dashboard". When you log into the portal for the first time, you are presented with this dashboard containing five tiles.
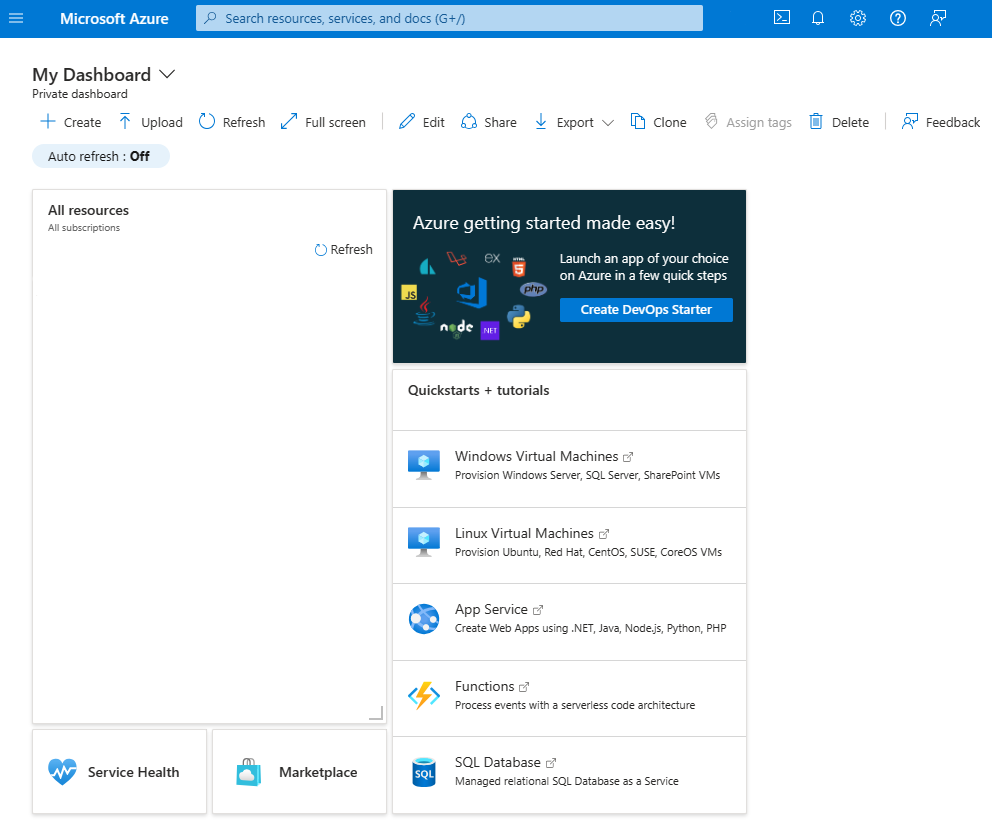
These default web parts are
- Dashboard controls
- All resources tile
- Quickstarts + tutorials tile
- Service Health tile
- Marketplace tile
Creating and managing dashboards
Along the top of the dashboard are the controls that enable you to create, upload, download, edit, and share a dashboard. You can also switch a dashboard to full screen, clone it, or delete it.

Select dashboard
To the far left of the toolbar is the Select Dashboard drop-down control. Clicking this control enables you to select from dashboards that you have already defined for your account. This control makes it simple for you to define multiple dashboards for different purposes and then switch from one to another and back again, depending on what you are trying to do at the time.
Note that any dashboards that you create will initially be private; that is, only you can see them. To make a dashboard available across your enterprise, you need to share it. We'll look at that option shortly.
Create a new dashboard
To create a new dashboard, click New dashboard. The dashboard workspace appears, with no tiles present. You can then add, remove and adjust tiles however you like. When you are finished customizing the dashboard, click Done customizing to save and switch to that dashboard.
Upload and Download
The Upload and Download buttons enable you to download your current dashboard as a JSON file, customize it, and then distribute it and upload it or have someone else upload that file back to the Azure portal, thereby replacing their current dashboard.
If you click Download, the current dashboard downloads the JSON code as a file you can edit locally. You can then upload it back to Azure by clicking the Upload button. This is discussed further below.
Edit a dashboard using the portal
Although you can edit a dashboard by downloading the JSON file, changing values in the file, and uploading the file back to Azure, that approach isn't intuitive for designing a user interface. To use the GUI to configure your current dashboard you can enter edit mode in several ways:
- Click the Edit (pencil icon) button.
- Right-click on the dashboard background area and select Edit.
- Right-click on a tile and a menu will appear with edit options.
- Hover over a tile on the dashboard - a
...menu will appear on the top/right corner with edit options.
The dashboard switches to edit mode.
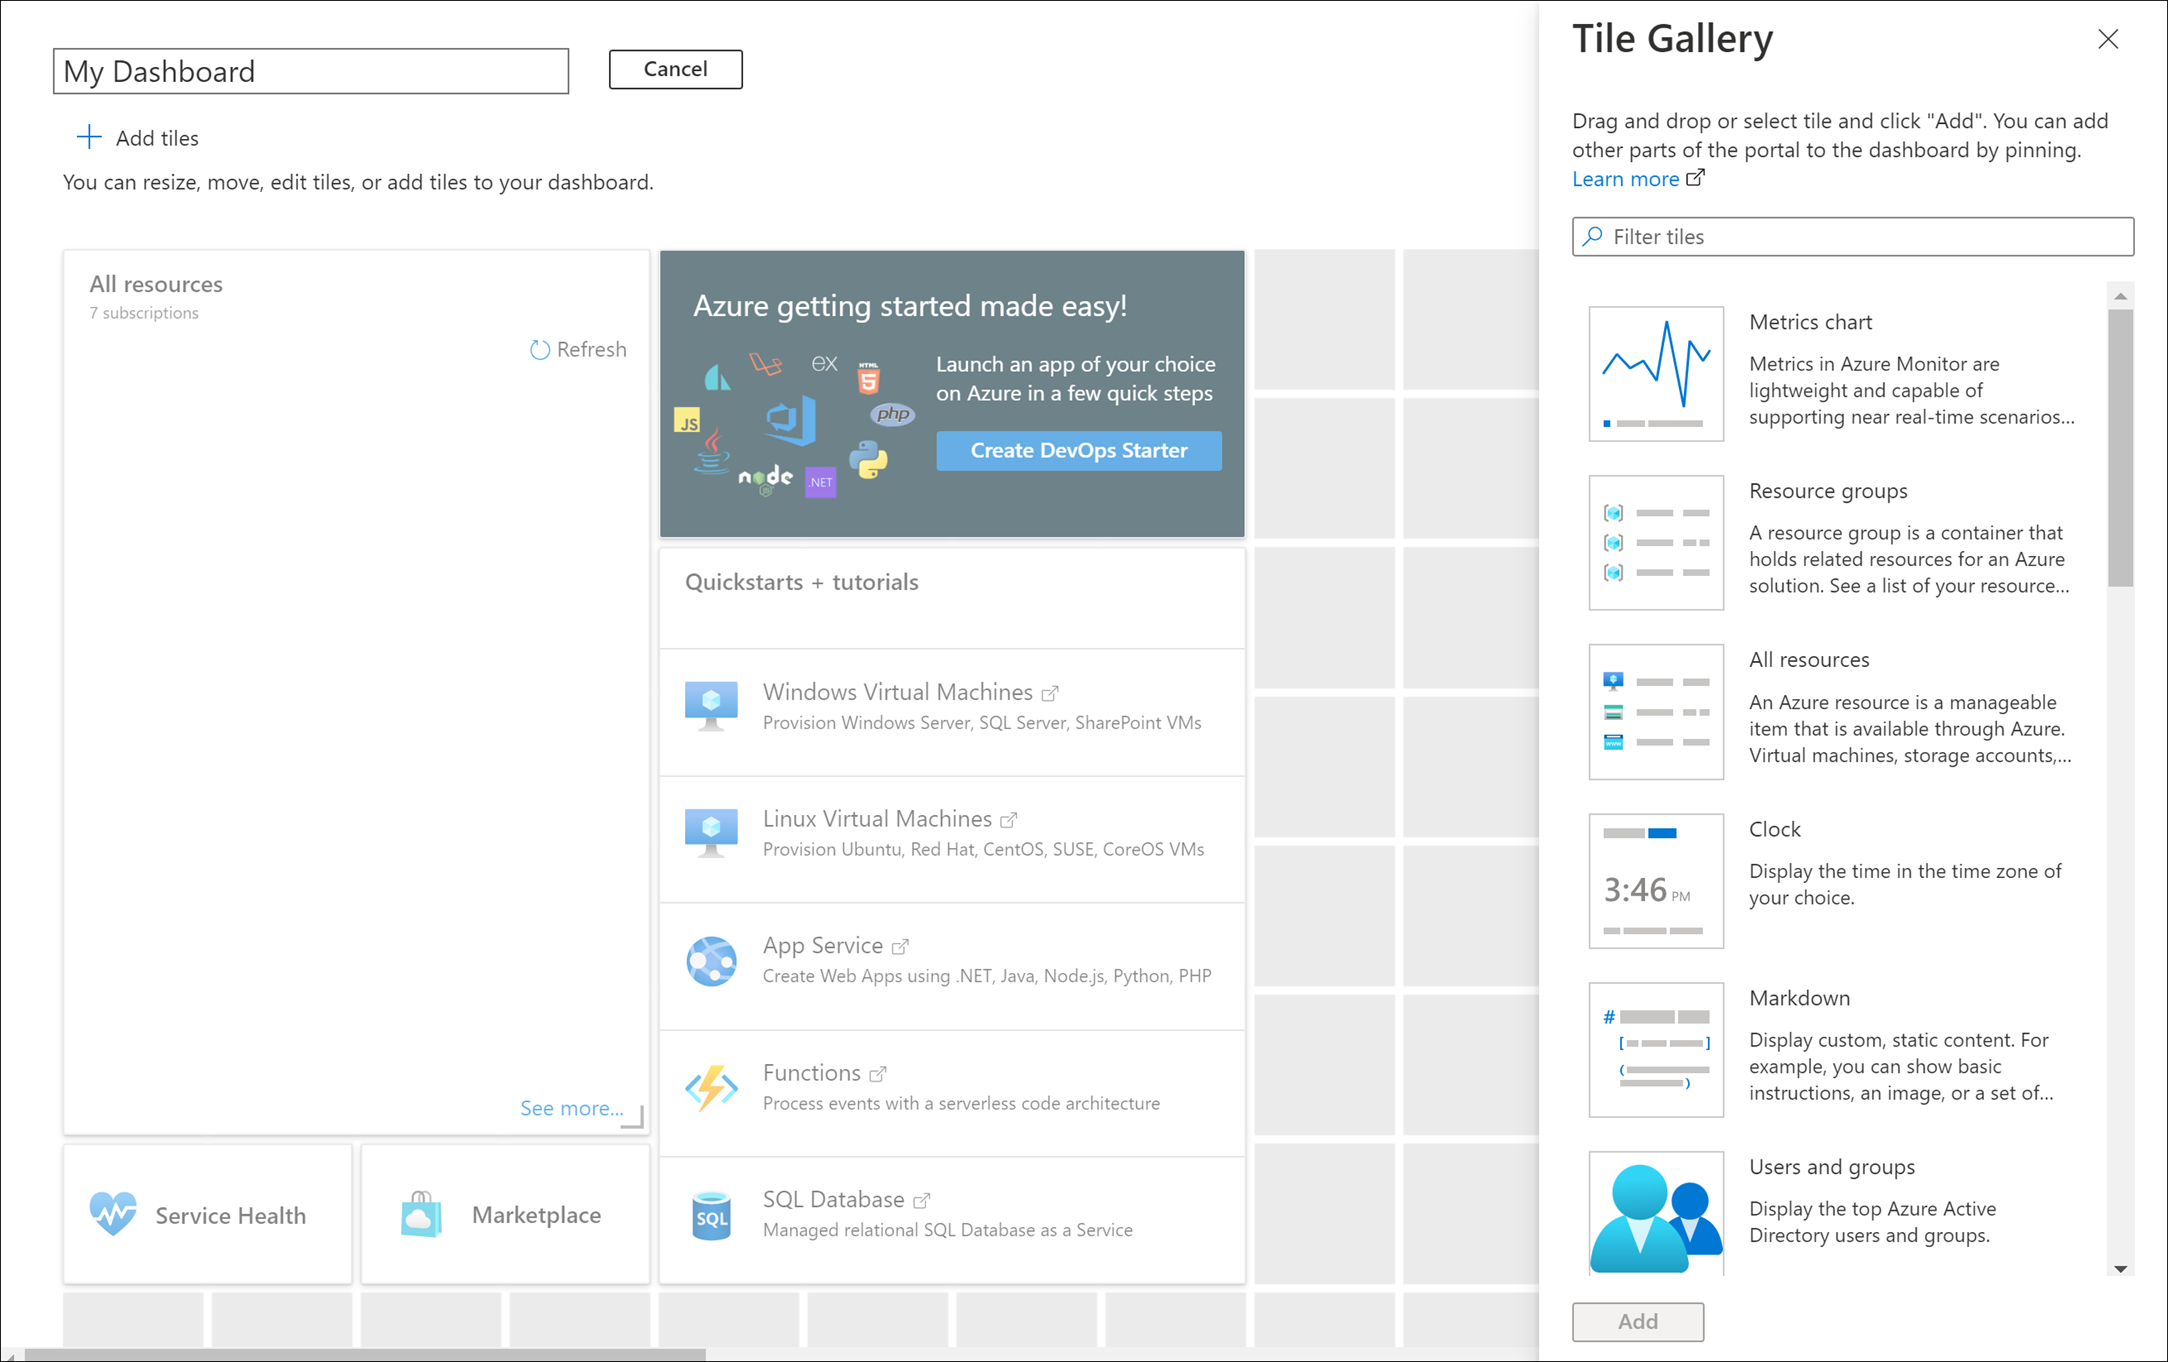
On the left-hand side appears the Tile Gallery, with several possible tiles. You can filter the Tile Gallery by category and resource type.
Adding tiles is as easy as selecting the tile from the list on the left and then dragging it to the work area. You can then move each tile about, resize it, or change the data that it displays.
Tip
One cool feature a lot of people are unaware of is that you can take elements on child blades and put them on your dashboard. Just hover over the item and look for the
... tile edit menu - this will have a "Pin to Dashboard" option which lets you quickly grab a tile from a service and put it onto the dashboard.
The work area in edit mode is divided into squares. Each tile must occupy at least one square, and tiles will snap to the nearest largest set of tile dividers. Any overlapping tiles are moved out of the way. When you make a tile smaller, the surrounding tiles will move back up against it.
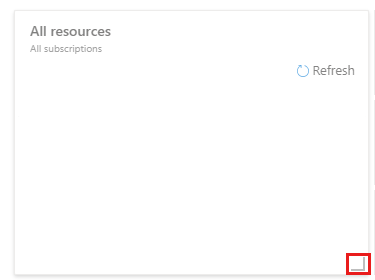
Change tile sizes
Some tiles have a set size, and you can edit their size only programmatically. However, you can edit tiles with a gray bottom right-hand corner by dragging the corner indicator.
Alternatively, right-click the context menu and specify the size you want.
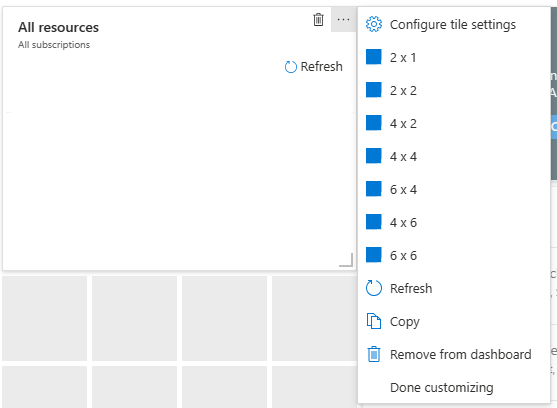
To create your dashboard, pull tiles from the Tile Gallery onto the workspace and then rearrange them.
Change tile settings
Some tiles have editable settings. For example, with the clock tile, when you drag it onto the workspace, it opens the Edit clock tile. You can then set the time zone, which it displays, and also set whether it displays in 12- or 24-hour format.
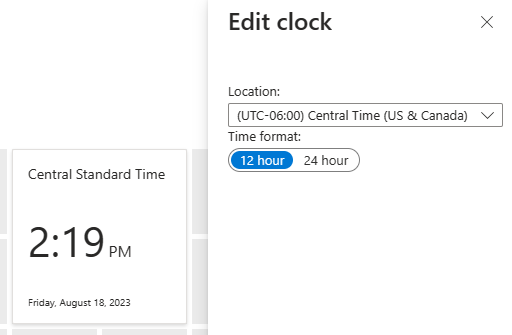
For multi-national or transcontinental companies, you can add clocks, each in a different time zone.
Accepting your edits
When you have arranged the tiles as you want them, either click Done customizing, or right-click and then click Done customizing.
Edit a dashboard by changing the JSON file
You can also edit a dashboard by changing the JSON file. This approach provides more options for changing settings, but you cannot see the changes until you upload the file back into Azure. The easiest starting point is to download the dashboard JSON as previously described and edit that file.

As an example, in the JSON shown above, to change the size of the tile you would edit the colSpan and rowSpanvariables, then save the file and upload it back to Azure.
Tip
You can also distribute the dashboard JSON file to other users.
Reset a dashboard
You can reset any dashboard to the default style. In edit mode, right-click the dashboard background and select Reset to default state. A dialog box will ask you to confirm that you want to reset that dashboard.
Share or unshare a dashboard
When you define a new dashboard, it is private and visible only to your account. To make it visible to others, you need to share a dashboard. However, as with any other Azure resource, you need to specify a new resource group (or use an existing resource group) in which to store shared dashboards. If you do not have an existing resource group, Azure will create a dashboards resource group in whichever location you specify. If you have existing resource groups, you can specify that resource group to store the dashboards.
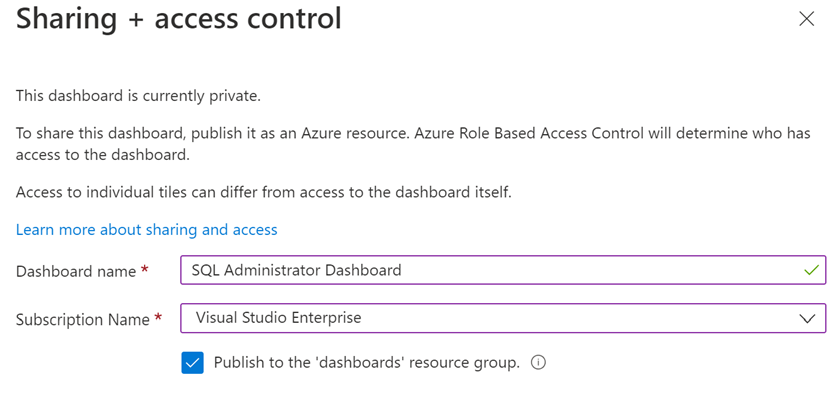
When you have shared the template, you will see a second Sharing + access control blade.

You can then click Manage users to specify the users who have access to that dashboard.
Switching to a shared dashboard
To switch to a shared dashboard, you click on the list of dashboards, and then click Browse all dashboards.

You will now see the All dashboards blade, with the names of any shared dashboards displayed. Just click on a dashboard to apply it to the Azure portal.

Display a dashboard as a full screen
If you want the largest dashboard real estate, click the Full screen button to display your current dashboard without any browser menus. If you have any tiles outside the boundaries of your screen display, slider bars will appear at the right and bottom of your screen.
When you have finished working in full-screen mode, press the ESC key or click Exit Full Screen next to the Dashboard name at the top of the screen.
Clone a dashboard
Cloning a dashboard creates an instant copy called "Clone of <dashboard name>" and switches to that copy as the current dashboard. Cloning is also an easy way to create dashboards before sharing them. For example, if you have a dashboard that is almost as you want it, clone it, make the changes that you need, and then share it.
Delete a dashboard
Deleting a dashboard removes it from your list of available dashboards. You are prompted to confirm that you want to delete the dashboard, but there is no facility to recover a dashboard that has been deleted.
Let's try out some of these options by creating a new dashboard.
No comments:
Post a Comment